
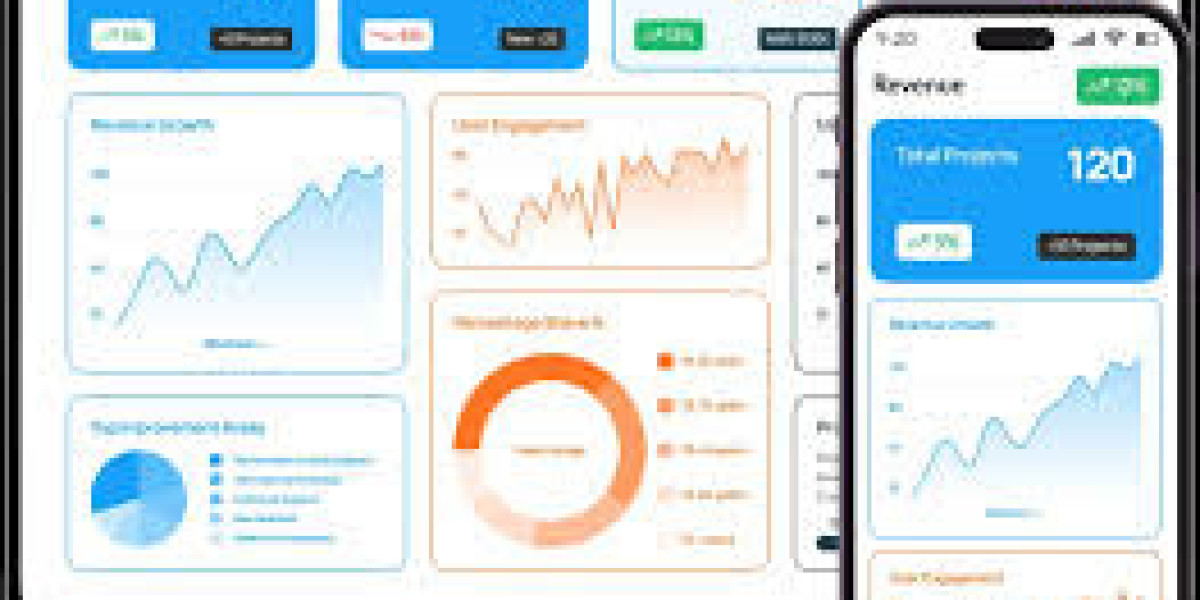

Businesses collect a large amount of data every day. However, data is useful only when it is easy to understand and act on. This is where data visualization services play an important role. They convert raw data into charts, dashboards, and reports that make information clear.
In business intelligence, the goal is simple. Help decision makers understand what is happening and what to do next. This is why companies invest in bi visualization services to improve clarity, speed, and accuracy in decision making.
What problem does data visualization solve in business intelligence?
Most companies already have data. The real issue is that the data is scattered across systems and often presented in complex formats. For example, a sales team may have thousands of rows of data in Excel. Reading that data line by line takes time and still may not show clear patterns. This creates confusion and delays decisions.
Data visualization solves this by presenting the same data in a visual format. A simple dashboard can show trends, comparisons, and performance in seconds. This reduces effort and improves understanding across teams.
How does data visualization improve decision making in real scenarios?
Data visualization makes decision making faster because it removes guesswork. Instead of analyzing raw numbers, managers can see clear patterns. For example, if a chart shows a drop in sales in a specific region, the issue becomes visible immediately. The team can then take action without delay.
According to industry studies, organizations using visual dashboards can improve decision speed by up to 4 to 5 times. This is because visual data is easier to process than text-based data. This is one reason why businesses work with data visualization consulting services to design dashboards that focus only on important metrics.
What types of data analytics are used with visualization?
In business intelligence, data is analyzed at different levels. Visualization helps present each level clearly.
- Descriptive analytics
This type shows what has already happened. It is usually displayed through reports, charts, or dashboards that summarize past performance. - Diagnostic analytics
This explains why something happened. For example, if sales dropped, this analysis helps identify the reason behind the drop. - Predictive analytics
This uses past data to estimate future outcomes. Visualization helps show these predictions in a simple and understandable way. - Prescriptive analytics
This suggests actions based on data. It helps businesses decide what steps to take next.
Which tools are commonly used for data visualization?
Different tools are used depending on business needs. These tools help create dashboards and reports that are easy to use.
Tool | Main Use |
Tableau | Interactive dashboards and advanced visuals |
Power BI | Business reporting and real-time analysis |
Google Data Studio | Simple dashboards and sharing reports |
Excel (Advanced) | Basic visualization for small datasets |
These big data visualization tools help companies manage large volumes of data and present it clearly.
What makes a data visualization actually useful?
Not every chart or dashboard is helpful. A good visualization should be simple and focused.
It should highlight only the important data, not everything at once. Too much information can confuse users instead of helping them.
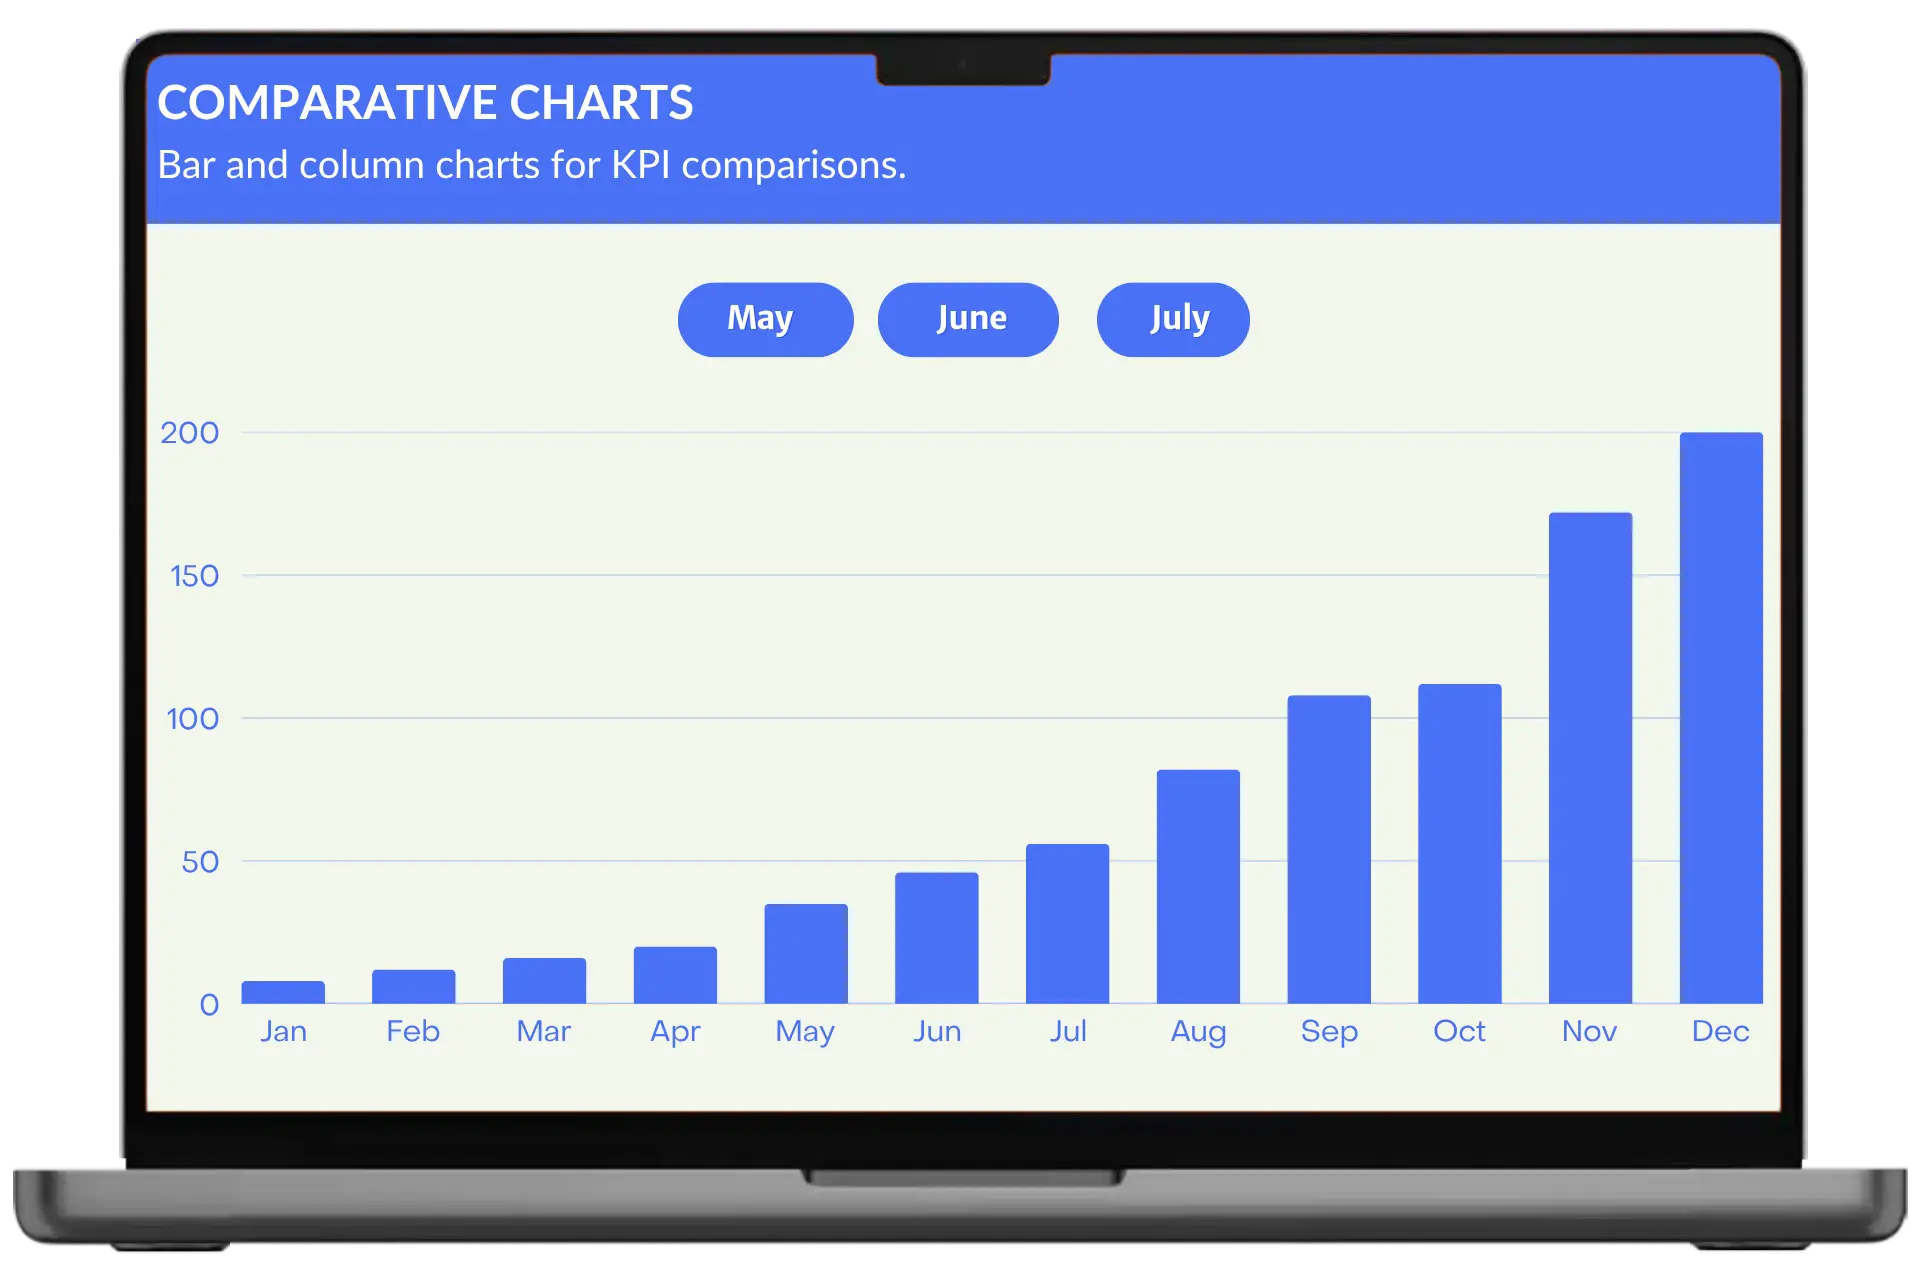
Also, choosing the right format matters. For example, line charts are better for trends, while bar charts work well for comparisons.
This is where data visualization consulting becomes useful. Experts help design dashboards that match business goals and user needs.
What happens when businesses do not use proper visualization?
When data is not presented properly, several problems can occur.
- Slow decision making
Teams take more time to analyze data manually, which delays important business actions and reduces efficiency. - Incorrect conclusions
Raw data can be misinterpreted easily, which may lead to wrong decisions and poor planning. - Lack of visibility
Important trends and patterns may go unnoticed, which affects business growth and performance tracking. - Poor team alignment
When data is not clear, different teams may understand it differently, which creates confusion.
How should a business choose the right visualization approach?
The approach should depend on business needs, not just tools.First, identify what needs to be tracked. For example, sales, customer behavior, or operational performance. This helps define the structure of the dashboard. Second, choose tools that match the data size and complexity. Small businesses may use simple tools, while large companies may need advanced platforms.
Finally, working with a data visualization consultant can help design dashboards that are clear, useful, and aligned with business goals.
What is changing in data visualization today?
Data visualization is becoming more advanced with the use of automation and AI. Modern systems can now update dashboards in real time and even highlight important insights automatically. This reduces manual effort and improves accuracy.
Companies are also focusing on custom data visualization solutions that match their specific business processes instead of using generic dashboards.
Final thoughts
Data alone does not help a business grow. Understanding data does.That is why data visualization is a key part of business intelligence. It simplifies complex information, improves decision making, and helps teams work more efficiently. Businesses that invest in the right tools and strategies will be able to use their data more effectively and stay ahead in a competitive market.
Related Article:
Custom CRM Development Cost: A Complete Guide for Businesses Making Smart Decisions
Why Most Startups Fail in Software Development?
How to Build a Mobile App from Scratch? A Complete Step-by-Step Guide
How to Build an MVP App: A Complete Guide for Startups?
Ubicación del Autor
2532 Santa Clara Ave, Unit #501, Alameda, CA 94501